Benefits Realisation Management is one of those classic programme / project disciplines that “everyone” agrees is a great idea, which in my experience is more overlooked than observed.
The main sources in the literature I’m aware of are books by Bradley and Ward & Daniels. I’ve also had the privilege of learning directly from Gerald Bradley, so my own approach is very much influenced by his work.
A key tool is the use of visual maps, both interactively with stakeholders to discover benefits, and then as a way of presenting and communicating the complex causal links between an IT investment and the benefits it allegedly supports.
Interactive mapping works best with tactile materials – Post-It notes, sticky card etc. But for analysis and presentation some kind of tool is needed – drawing tools may work for smaller maps, but it very quickly becomes impractical, and something model-based is required.
Specialised tools are available, but they are just that, specialised tools: a good investment perhaps, but nevertheless a substantial outlay. The lack of affordable tools might, I suggest, be a block to wider adoption of these methods.
I’ve blogged before about using general purpose UML modelling tools to help programme shaping, so it was natural that I looked at extending this approach to benefits mapping.
An example benefits map using the UML approach is shown here, produced using Sparx Enterprise Architect:
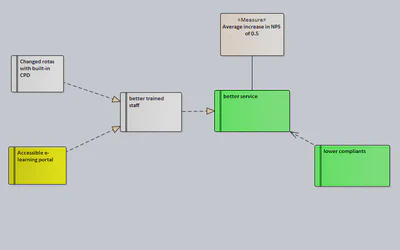
I have created a UML Profile (which I will write more about later), which extends the Requirement metaclass provided in Enterprise Architect by stereotyping to create the five core Benefits Realisation Management objects:
| Element | Description |
|---|---|
| Objectives | Why are we doing this? |
| Benefits | A measurable indicator of a change which is perceived as positive by at least one stakeholder group |
| Disbenefits | A measurable indicator of a change which is perceived as negative by at least one stakeholder group |
| Business Changes | Any change in the way a business operates, for example in terms of resourcing, behaviours, skills, processes etc. |
| Enablers | Typically something that can be built or bought |
Readers familiar with Benefits maps will have spotted something different about the arrows. Most graphical presentations use an arrow from the precursor enabler, change or benefit to the subsequent change, benefit or objective.
Unfortunately this is not UML compliant, so I have chosen to model using UML dependency and realisation relationships:
| Relationship | Meaning |
|---|---|
 | This objective or benefit depends on that benefit |
 | This change or enabler implements that change or benefit |
Using the language constructs in this way means that it is possible to use the traceability features within the tool to identify all the chains of dependencies.
Later posts will cover the development of the UML Profile, including the addition of attributes to the benefits and the modelling of measures.
I’m in the middle of a review cycle with a group of stakeholders who are used to talking about project benefits, but who perhaps have not used visual maps before – I shall blog how it goes!
What approaches have you used to document project benefits in a graphical format? Please leave a comment…