One of the best data journalists helping to explain the Coronavirus pandemic is John Burn-Murdoch from the Financial Times. The latest version of their reporting is at ft.com/coronavirus-latest. The daily tweets highlighting his latest charts are a must-read, and serve as a factual counter to the increasingly ineffectual bluster from official press conferences.
Looking in detail at his charts from yesterday, 1st April 2020.
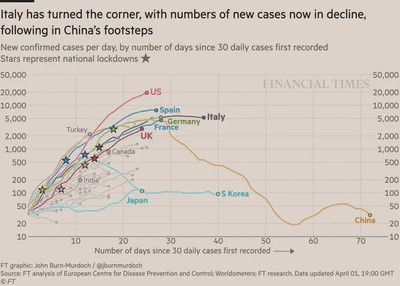
Cases
Although reported case numbers are, of course, impacted by different testing regimes, the first charts are based on cases.
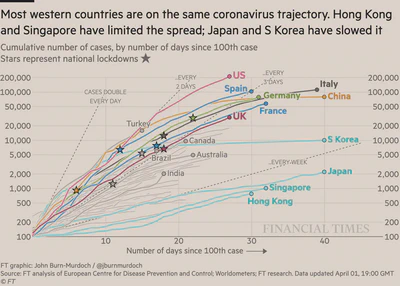
Looking cumulatively since the outbreak began there is further evidence of the difference between countries.
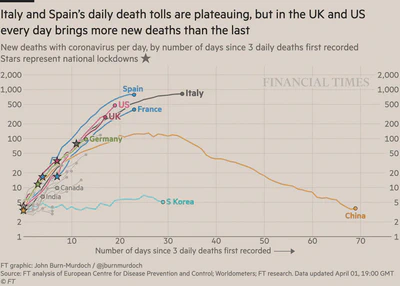
Deaths
Similar charts for reported deaths per day:
and cumulatively
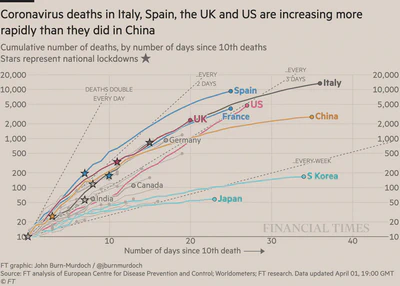
From both these sets of charts it is clear that any hint of optimism or complacency from the UK Government is built on sand. The daily case data from China also illustrates the risk of an uptick once restrictions start to be eased.
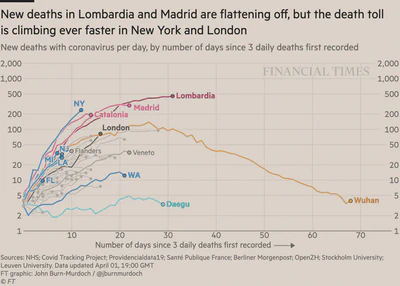
A local look
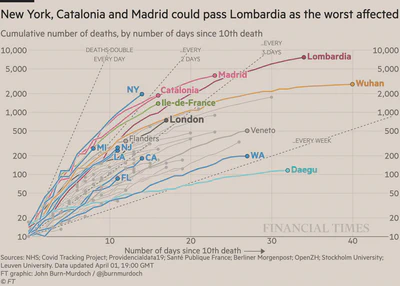
John has also started to present figures for cities/regions, both of which show brutally the scenarios in New York, London and parts of Spain:
and cumulatively
As a London resident I think it will be interesting to dig into the data provided by the UK Government down to Local Authority level.