Introduction
I wanted an opportunity to try out Datasette for a bit of ad-hoc data analysis, with the ability to easily share the results. To quote the tool home page:
Datasette is a tool for exploring and publishing data. It helps people take data of any shape, analyze and explore it, and publish it as an interactive website and accompanying API.
The data
The Department for Education (DfE) publish Initial Teacher Training (ITT) application data each month — Monthly statistics on initial teacher training recruitment: 2023 to 2024
Each month a zip file is published containing a number of CSV files.
Further information on the statistics can be found here, and it’s worth a read, not least to understand the complications caused by each candidate being allowed multiple applications.
This background is also very relevant, especially where it speaks about the incompleteness of these statistics:
Applications for courses starting in the 2023 to 2024 academic year are submitted in the October 2022 to September 2023 recruitment cycle (ITT2023) or deferred from the previous cycle for a 2023 to 2024 course start date.
Teacher training applications made directly to providers or Teach First are not included. Undergraduate teacher training is also not included.
These statistics collect data from 11 October 2022 to 15 May 2023 (ITT2023) and include deferred applications from the October 2021 to September 2022
TL;DR
Using Datasette and a selection of command line tools I was able to import and explore the data, create a nice Cumulative Flow Diagram that allowed me to answer a question, and publish the results on a website.
A couple of things that I didn’t need for this test but will want to use later didn’t seem to work, but that might be a lack of understanding on my part. (SpatiaLite integration)
Environment for experiments
The following experiments were conducted in a Ubuntu 22.04 environment running on Windows Subsystem for Linux (WSL2).
Python 3 is already installed.
I am going to use Datasette as a tool for exploring the data.
Data questions
- Is there a bottleneck in processing of applications?
Downloading the data
Unfortunately the download URLs of the zip files are not a consistent pattern so we have to download each explicitly
Create new repo on WSL at ~/data/itt. All paths now are relative to root of repo
mkdir -p ./data/orig
cd data.orig
Get May 2023 data like this
wget -O itt_2023_05.zip https://assets.publishing.service.gov.uk/government/uploads/system/uploads/attachment_data/file/1162196/Initial_teacher_training_recruitment_candidate_applications_and_numbers_May_2023.zip -
And so on, adjusting the source URL and the output file as needed back through the files ending up at:
wget -O itt_2022_11 https://assets.publishing.service.gov.uk/government/uploads/system/uploads/attachment_data/file/1122970/Initial_teacher_training_recruitment_candidate_applications_and_numbers__November_2022__1_.zip
I then unzipped these into a folder for each month:
mkdir 2023-24
q=0; while [[ q -lt 2 ]]; do ((q++)); mkdir 2023-24/2022-1$q; done
q=0; while [[ q -lt 6 ]]; do ((q++)); mkdir 2023-24/2023-0$q; done

q=0; while [[ q -lt 2 ]]; do ((q++)); unzip itt_2022_1$q.zip -d 2023-24/2022-1$q; done

q=0; while [[ q -lt 5 ]]; do ((q++)); unzip itt_2023_0$q.zip -d 2023-24/2023-0$q; done
There was some further manual tidying up to remove inconsistencies in sub-folders within the zip files.
Our files now look like this (from the root of our working directory):
tree -a -I '.git'

.
└── data
    └── orig
        ├── 2023-24
        │   ├── 2022-11
        │   │   ├── monthly-statistics-applications-by_course_age_group-2022-11.csv
        │   │   ├── monthly-statistics-applications-by_course_type-2022-11.csv
        │   │   ├── monthly-statistics-applications-by_primary_specialist_subject-2022-11.csv
        │   │   ├── monthly-statistics-applications-by_provider_area-2022-11.csv
        │   │   ├── monthly-statistics-applications_by_status-2022-11.csv
        │   │   ├── monthly-statistics-by_secondary_subject-2022-11.csv
        │   │   ├── monthly-statistics-candidates-by_age_group-2022-11.csv
        │   │   ├── monthly-statistics-candidates-by_area-2022-11.csv
        │   │   ├── monthly-statistics-candidates-by_sex-2022-11.csv
        │   │   └── monthly-statistics-candidates_by_status-2022-11.csv
        │   ├── 2022-12
        │   │   ├── Dec_monthly_stats_2022
        │   │   ├── monthly-statistics-applications-by_course_age_group-2022-12.csv
        │   │   ├── monthly-statistics-applications-by_course_type-2022-12.csv
        │   │   ├── monthly-statistics-applications-by_primary_specialist_subject-2022-12.csv
        │   │   ├── monthly-statistics-applications-by_provider_area-2022-12.csv
        │   │   ├── monthly-statistics-applications-by_secondary_subject-2022-12.csv
        │   │   ├── monthly-statistics-applications_by_status-2022-12.csv
        │   │   ├── monthly-statistics-candidates-by_age_group-2022-12.csv
        │   │   ├── monthly-statistics-candidates-by_area-2022-12.csv
        │   │   ├── monthly-statistics-candidates-by_sex-2022-12.csv
        │   │   └── monthly-statistics-candidates_by_status-2022-12.csv
        │   ├── 2023-01
        │   │   ├── monthly-statistics-applications-by_course_age_group-2023-01.csv
        │   │   ├── monthly-statistics-applications-by_course_type-2023-01.csv
        │   │   ├── monthly-statistics-applications-by_primary_specialist_subject-2023-01.csv
        │   │   ├── monthly-statistics-applications-by_provider_area-2023-01.csv
        │   │   ├── monthly-statistics-applications-by_secondary_subject-2023-01.csv
        │   │   ├── monthly-statistics-applications_by_status-2023-01.csv
        │   │   ├── monthly-statistics-candidates-by_age_group-2023-01.csv
        │   │   ├── monthly-statistics-candidates-by_area-2023-01.csv
        │   │   ├── monthly-statistics-candidates-by_sex-2023-01.csv
        │   │   └── monthly-statistics-candidates_by_status-2023-01.csv
        │   ├── 2023-02
        │   │   ├── monthly-statistics-applications-by_course_age_group-2023-02.csv
        │   │   ├── monthly-statistics-applications-by_course_type-2023-02.csv
        │   │   ├── monthly-statistics-applications-by_primary_specialist_subject-2023-02.csv
        │   │   ├── monthly-statistics-applications-by_provider_area-2023-02.csv
        │   │   ├── monthly-statistics-applications-by_secondary_subject-2023-02.csv
        │   │   ├── monthly-statistics-applications_by_status-2023-02.csv
        │   │   ├── monthly-statistics-candidates-by_age_group-2023-02.csv
        │   │   ├── monthly-statistics-candidates-by_area-2023-02.csv
        │   │   ├── monthly-statistics-candidates-by_sex-2023-02.csv
        │   │   └── monthly-statistics-candidates_by_status-2023-02.csv
        │   ├── 2023-03
        │   │   ├── monthly-statistics-applications-by_course_age_group-2023-03.csv
        │   │   ├── monthly-statistics-applications-by_course_type-2023-03.csv
        │   │   ├── monthly-statistics-applications-by_primary_specialist_subject-2023-03.csv
        │   │   ├── monthly-statistics-applications-by_provider_area-2023-03.csv
        │   │   ├── monthly-statistics-applications-by_secondary_subject-2023-03.csv
        │   │   ├── monthly-statistics-applications_by_status-2023-03.csv
        │   │   ├── monthly-statistics-candidates-by_age_group-2023-03.csv
        │   │   ├── monthly-statistics-candidates-by_area-2023-03.csv
        │   │   ├── monthly-statistics-candidates-by_sex-2023-03.csv
        │   │   └── monthly-statistics-candidates_by_status-2023-03.csv
        │   ├── 2023-04
        │   │   ├── monthly-statistics-applications-by_course_age_group-2023-04.csv
        │   │   ├── monthly-statistics-applications-by_course_type-2023-04.csv
        │   │   ├── monthly-statistics-applications-by_primary_specialist_subject-2023-04.csv
        │   │   ├── monthly-statistics-applications-by_provider_area-2023-04.csv
        │   │   ├── monthly-statistics-applications-by_secondary_subject-2023-04.csv
        │   │   ├── monthly-statistics-applications_by_status-2023-04.csv
        │   │   ├── monthly-statistics-candidates-by_age_group-2023-04.csv
        │   │   ├── monthly-statistics-candidates-by_area-2023-04.csv
        │   │   ├── monthly-statistics-candidates-by_sex-2023-04.csv
        │   │   └── monthly-statistics-candidates_by_status-2023-04.csv
        │   └── 2023-05
        │       ├── monthly-statistics-applications-by_course_type-2023-05.csv
        │       ├── monthly-statistics-applications-by_primary_specialist_subject-2023-05.csv
        │       ├── monthly-statistics-applications-by_provider_area-2023-05.csv
        │       ├── monthly-statistics-applications-by_secondary_subject-2023-05.csv
        │       ├── monthly-statistics-applications_by_status-2023-05.csv
        │       ├── monthly-statistics-candidates-by_age_group-2023-05.csv
        │       ├── monthly-statistics-candidates-by_area-2023-05.csv
        │       ├── monthly-statistics-candidates-by_course_age_group-2023-05.csv
        │       ├── monthly-statistics-candidates-by_sex-2023-05.csv
        │       └── monthly-statistics-candidates_by_status-2023-05.csv
        ├── itt_2022_11.zip
        ├── itt_2022_12.zip
        ├── itt_2023_01.zip
        ├── itt_2023_02.zip
        ├── itt_2023_03.zip
        ├── itt_2023_04.zip
        └── itt_2023_05.zip
Cleaning the data
- Install Pipx
- Install sqlite
Set up datasette venv:
pipx install datasette
pipx inject datasette sqlite-utils
Create an empty database that we will populate with our cleaned data:
cd ./data
sqlite-utils create-database itt.db
For our first question we need to look at the applications by status for each month, and combine these into a single table, with a date column added set to the last day of the sample month.
The data is in CSV files with the filename monthly-statistics-applications_by_status-yyyy-mm.csv
$ cd data/orig/2023-24/2023-05
$ column -s, -t < monthly-statistics-applications_by_status-2023-05.csv | less -#2 -N -S
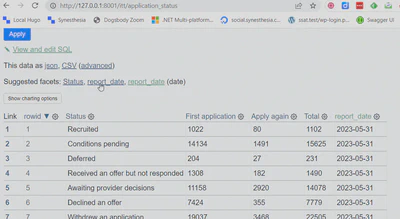
1 Status First application Apply again Total
2 Recruited 1022 80 1102
3 Conditions pending 14134 1491 15625
4 Deferred 204 27 231
5 Received an offer but not responded 1308 182 1490
6 Awaiting provider decisions 11158 2920 14078
7 Declined an offer 7424 355 7779
8 Withdrew an application 19037 3468 22505
9 Application rejected 26245 6335 32580
Our process is:
- insert the 2023-05 data into a new table
application_status - insert a column
reportdate - set
reportdateto 31/05/2023 in all rows - for each remaining CSV
- import CSV to temp table application_status_yymm
- select into
application_statusadding correct value forreportdate
# in data directory
# initial import
sqlite-utils insert itt.db application_status orig/2023-24/2023-05/monthly-statistics-applications_by_status-2023-05.csv --csv

# query in sqlite3
sqlite3 itt.db

# see column names
sqlite> PRAGMA table_info(application_status);

0|Status|TEXT|0||0
1|First application|TEXT|0||0
2|Apply again|TEXT|0||0
3|Total|TEXT|0||0

# see data
sqlite> select * from application_status;
Recruited|1022|80|1102
Conditions pending|14134|1491|15625
Deferred|204|27|231
Received an offer but not responded|1308|182|1490
Awaiting provider decisions|11158|2920|14078
Declined an offer|7424|355|7779
Withdrew an application|19037|3468|22505
Application rejected|26245|6335|32580

sqlite>.quit
As we can see the initial table has been created, so we need to add the report_date column and fill it. Note also the data type of the columns First application, Apply again and Total is wrong, we will fix that if necessary after we import the other data. (Datasette seems to be very forgiving about data types).
We plan to store dates as ISO8601 strings ("YYYY-MM-DD"), so our new report_date column should be of type TEXT.
sqlite-utils add-column itt.db application_status report_date text
sqlite3 itt.db

sqlite> PRAGMA table_info(application_status);
0|Status|TEXT|0||0
1|First application|TEXT|0||0
2|Apply again|TEXT|0||0
3|Total|TEXT|0||0
4|report_date|TEXT|0||0

sqlite> UPDATE application_status SET report_date='2023-05-31' WHERE report_date IS NULL OR report_date = '';

sqlite> select * from application_status;
Recruited|1022|80|1102|2023-05-31
Conditions pending|14134|1491|15625|2023-05-31
Deferred|204|27|231|2023-05-31
Received an offer but not responded|1308|182|1490|2023-05-31
Awaiting provider decisions|11158|2920|14078|2023-05-31
Declined an offer|7424|355|7779|2023-05-31
Withdrew an application|19037|3468|22505|2023-05-31
Application rejected|26245|6335|32580|2023-05-31
Now we need to import the earlier data sets into their temp tables.
for PERIOD in 2022-11 2022-12 2023-01 2023-02 2023-03 2023-04;
do
sqlite-utils insert itt.db application_status_$PERIOD orig/2023-24/$PERIOD/monthly-statistics-applications_by_status-$PERIOD.csv --csv
done
To merge this data into the main table we use INSERT INTO … SELECT…
Note use of "" to enclose table and column names that would otherwise be invalid, and ’’ for string literals.
INSERT INTO application_status SELECT Status, "First Application", "Apply Again", "Total", '2022-11-30' FROM "application_status_2022-11";

INSERT INTO application_status SELECT Status, "First Application", "Apply Again", "Total", '2022-12-31' FROM "application_status_2022-12";

INSERT INTO application_status SELECT Status, "First Application", "Apply Again", "Total", '2023-01-31' FROM "application_status_2023-01";

INSERT INTO application_status SELECT Status, "First Application", "Apply Again", "Total", '2023-02-28' FROM "application_status_2023-02";

INSERT INTO application_status SELECT Status, "First Application", "Apply Again", "Total", '2023-03-31' FROM "application_status_2023-03";

INSERT INTO application_status SELECT Status, "First Application", "Apply Again", "Total", '2023-04-30' FROM "application_status_2023-04";
First check in Datasette
datasette data/itt.db
Looking at http://127.0.0.1:8001/itt/application_status we can now browse our rather trivial table and play around with the Datasette controls:
Adding a graph
Remembering our first data question, to explore whether there is a good flow through the application process we want to plot a cumulative flow diagram of our data.
We will use the datasette-dashboards plugin to render a dashboard in our datasette web app.
datasette install datasette-dashboards
touch data/metadata.yml
From now on we will need to run datasette like this:
datasette data/itt.db --metadata=data/metadata.yml
There are no dashboards to see yet, so we need to populate data/metadata.yml.
Initial content looks like
title: Datasette demo of DfE ITT stats
plugins:
  datasette-dashboards:
    itt-applications:
      title: ITT applications
      description: Data about applications to Initial Teacher Training
      layout:
        - [analysis-note]
      charts:
        analysis-note:
          library: markdown
          display: |-
            # Analysis notes
            > A look through the DfE ITT application statistics for training in 2023-24
Running datasette we now have a maenu item top right that takes us to a dashboard page, with a single dashboard listed ITT Applications
Opening that we see the dashboard, currently just containing the markdown test block we added:
Now we need to add our chart.
First in data/metadata.yml add a new chart to the layout, and then start the definition of the chart:
title: Datasette demo of DfE ITT stats
plugins:
  datasette-dashboards:
    itt-applications:
      title: ITT applications
      description: Data about applications to Initial Teacher Training
      layout:
        - [analysis-note, applications-cfd]
      charts:
        analysis-note:
          library: markdown
          display: |-
            # Analysis notes
            > A look through the DfE ITT application statistics for training in 2023-24
        applications-cfd:
          title: Cumulative flow of applications
          width: 600
          height: 400
          db: itt
          query: SELECT Status as status, Total as total, report_date FROM application_status ORDER BY report_date
          library: vega-lite
          display:
          #(continued...)
The datasette-dashboards plugin documentation states that the display property:
- Requires a valid Vega specification object
- Some fields are pre-defined:
$schema,description,autosize,data,signals - All fields are passed along as-is (overriding pre-defined fields if any)
- Only
markandencodingfields are required as the bare-minimum
To work out the display specification we need to look at the Vega-Lite examples gallery, specifically the Stacked Area Chart
Our data/metadata.yml file now looks like this:
title: Datasette demo of DfE ITT stats
plugins:
  datasette-dashboards:
    itt-applications:
      title: ITT applications
      description: Data about applications to Initial Teacher Training
      layout:
        - [analysis-note, applications-cfd]
      charts:
        analysis-note:
          library: markdown
          display: |-
            # Analysis notes
            > Data source [DfE](https://www.gov.uk/government/publications/monthly-statistics-on-initial-teacher-training-recruitment-2023-to-2024)
            >
            > Minimal processing — extract the data, transform to add report dates, load to the database.
        applications-cfd:
          title: Cumulative flow of applications
          db: itt
          query: SELECT Status as status, Total as total, report_date FROM application_status ORDER BY report_date
          library: vega-lite
          display:
            mark: { type: area, tooltip: true }
            encoding:
              x: { field: report_date, timeUnit: yearmonth }
              y: { aggregate: "sum", field: total }
              color: {field: status}
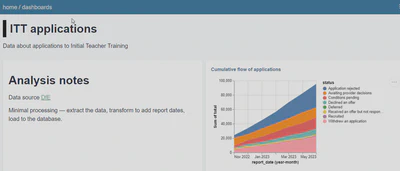
Our dashboard now looks like this:
Looking closely at the chart, the order of the stack is not helpful, it would be better if there were some approximation to process order.
I found at least part of the answer in this StackOverflow answer, and edited the display part of this chart definition to look like this:
display:
  transform:
    -    {calculate: "indexof([ 'Conditions Pending', 'Awaiting provider decisions', 'Deferred', 'Recruited',  'Withdrew an application', 'Received an offer but did not respond', 'Declined an offer', 'Application rejected'], datum.status)",  as: "order"  }
    mark: { type: area, tooltip: true }
    encoding:
      x: { field: report_date, timeUnit: yearmonth }
      y: { aggregate: "sum", field: total }
      color: {field: status, scale: {"scheme": "tableau10"}}
      order: {field: "order", type: "ordinal"}
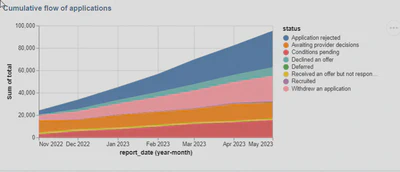
This sorts the order of the stack so the chart now looks like:
I looked for ways to change the order of the legend categories to match but so far have been unsuccessful.
Answering the question
The question I posed was “Is there a bottleneck in processing of applications?”.
Looking at the series on the chart for “Awaiting provider decisions” it is roughly the same height and same slope over time, suggesting that the delay through that stage is approximately constant, and therefore that applications are being determined at roughly the rate they are being presented. (A closer look might suggest that a bottleneck is starting to appear in May 2023, but without finer grained data it is hard to be certain).
The series “Conditions pending” could be indicative of a growing backlog in the process, but without further information it’s impossible to tell where this sits between applicants, providers and the DfE.
A wider reflection on the data so far
In the wider context, my biggest concerns with this data are:
- the scope statement I quoted at the beginning - without this data how can the overall state of recruitment be judged?
Teacher training applications made directly to providers or Teach First are not included. Undergraduate teacher training is also not included.
- the absolutely tiny fraction of applicants that make it through to being recruited - what lies behind that?
- where (if anywhere) is the underlying data? The datasets in this collection are all aggregated statistical returns, are there other factors worthy of analysis?
Sharing the analysis so far
One of the benefits of Datasette is the ability to quickly publish a set of data and dashboards to a number of different hosting services.
I decided to try publishing to Vercel, as I already have a free account there.
Install the Vercel CLI
Add the plugin
datasette install datasette-publish-vercelpublish the site
datasette publish vercel data/itt.db --project itt -m data/metadata.yml --install datasette-dashboardscheck the site location at https://itt-lac.vercel.app/, with dashboard at https://itt-lac.vercel.app/-/dashboards/itt-applications
Reflections
The core reason for this experiment was to do an end-to-end test of Datasette to see how easy it is to use and to get usable output using a tiny data set.
In a way it’s typical open-source - not glossy except where it has to be, but focused on the functionality. When you add in the power of the plugin ecosystem and the out-of-the-box web publishing this tool does a lot. You have to remind yourself that the vast majority of the code you are using is the product of one person, because the functionality is deep.
Becasuse I was starting from zero and making these notes as I went, it took a long time to get to the very basic result. If I was just doing this quick and dirty analysis would I use Datasette? Probably not if I had Excel to hand.
But as soon as you need an environment where you can easily script things like data transformations, enter adhoc queries, add visualisations, and even share on the web, then I’m starting to like Datasette. And of course all of these tools are free open source.
Unsurprisingly the bit that took the most time was around visualisations (it always is), so a fair bit of time was not related to the core of Datasette but to the datasette-dashboards plugin and the associated Vega-Lite library.
Out of the box the generated website is open access, so you would not want to use this for confidential analysis. However there is a whole section in the Datasette documentation on authentication and permissions, and it looks like there are plenty of options (and the opportunity to write a plugin if what you need isn’t there).
Next steps
The code for this exploration is available on Github at synesthesia/datasette-itt.
I want to try some geo-related analysis of some of the other tables available in this dataset, and originally installed the SpatiaLite extensions, However I found that the Vercel plugin doesn’t seem to support that feature (at least I couldn’t get the site to work with SpatiaLite installed). As the geo-related functionality is a very appealing part of the Datasette feature list I will want to spend some more time on this later.
#100DaysToOffload 40/100